

How Huge Pages Affect System Behavior
This is Part 2 of a three-part series. Part 1 established how different workloads respond to changes in shared_buffers allocation. Here we introduce huge_pages and use Linux PSI to examine their impact on system behavior, memory pressure, and database performance.
Introducing Huge Pages
On a modern system, the application does not get to use the memory directly. Instead the operating system (kernel) presents a virtual memory space and uses a Transaction Lookaside Buffer (TLB) buffer to map the process memory space to physical addresses.
There is a small TLB buffer available on a modern CPU that can make the translation without triggering an additional memory lookup. Allocating a number of huge_pages can reduce memory consumption and increase performance for memory heavy jobs.
What huge_pages are and how they interact with the OS
PostgreSQL and the OS can be configured to use either the default 4KB pages, 2MiB or 1GiB huge pages. The larger page sizes reduce the overhead of page-table walks as well as the size of the page table. Memory lookups and translation from process memory space to physical space can significantly improve.
The following table shows the CPU TLB sizes for the processor used in this experiment:
| Huge Pages | L1 Data entries | L2 Data | Max space L1 + L2 |
|---|---|---|---|
| 4K | 64 | 2048 | 256KB + 8MB |
| 2M | 64 | 2048 | 128MB + 4GB |
| 1G | 64 | 64 | 64GB + 64GB |
The rightmost column shows the maximum amount of memory we can address with the cpu onboard TLB so before we start generating TLB cache misses.
I repeated the experiments run previously with both 2MB and 1GB huge pages. The goal was to see whether huge_pages made a significant difference in performance for these specific workloads. For a more detailed description of the workloads, please refer to part 1 of this blog series.
Linux kernel also supports transparent huge pages (THP) that were not used. This feature is not ideal for database workloads as the background process that tries to convert contiguous pages into a large page can cause stalls in performance.
During my tests, the huge page size and number of pages were allocated during boot. We started with the maximum allocation and released an appropriate number of pages at each step.
1 GiB huge_pages and Their Un‑reclaimable Nature
1 GiB huge pages are the largest static page size supported on my system. Because each page consumes an entire gigabyte of physical memory, the kernel treats them as un‑reclaimable. They are not eligible for the normal page‑reclaim mechanisms that free up memory under pressure. If a system reserves too many 1 GiB pages, the remaining memory pool for the rest of the OS and for other applications may be insufficient for proper operation.
During my testing, any allocation over 70GB of RAM to shared_buffers in 1GB pages resulted in an OOM killer eventually killing my database under load. That data was removed from my results. It is important to keep in mind that using 1GB huge pages puts in a lower absolute amount of memory that can be reasonably allocated to the database and have a working production system.
Effects of huge_pages on performance
We do not see a significant difference in performance with a TPC-B type workload. This type of workload is simple in how it accesses shared buffers, with each data page only accessed once, or at most a handful of times, before it needs to be evicted.
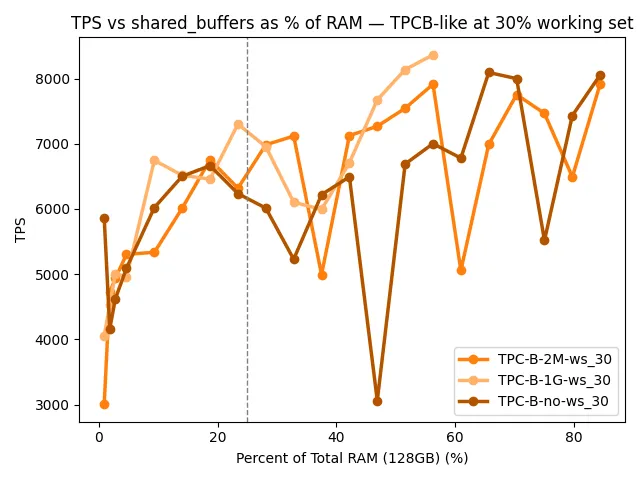
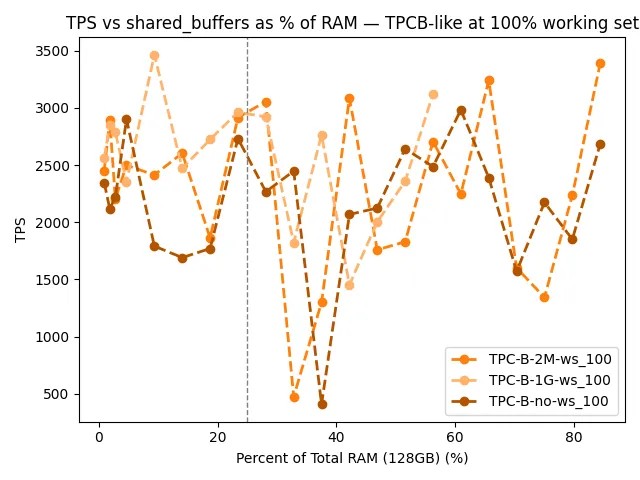
Similarly the overall performance characteristics did not change significantly for the analytics workload either, as in the previous part we saw the memory pressure was not a huge source of contention. Compared to the time required to load data from disk, or to obtain a lock within a database, the memory translation is insignificant.
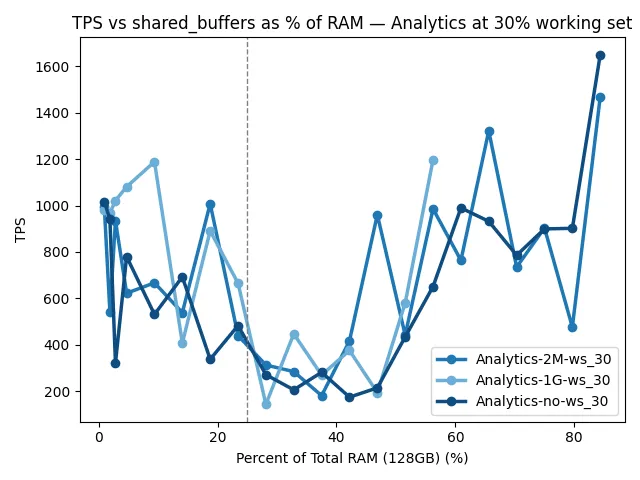
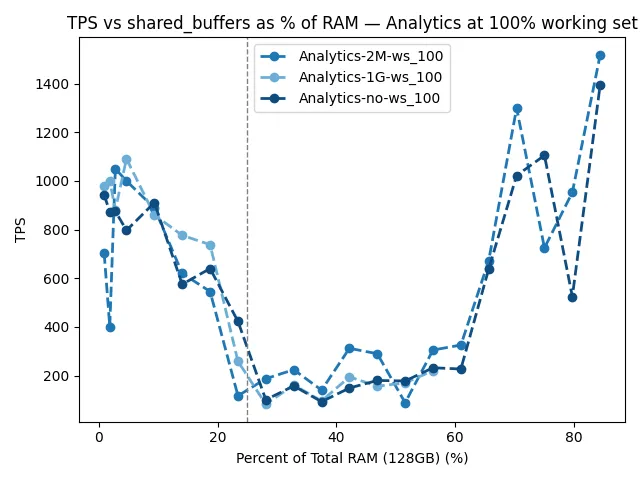
TPS vs shared_buffers as % of RAM - Analytics at 100% working set
While huge_pages did not make a huge difference in my specific workloads, there is a possibility that other workloads may differ, especially in a system with a significantly higher core and connection count. In my experiment the maximum overall throughput was at 100 simultaneous clients, which may not be enough contention for memory to show here.
Effect of huge_pages on memory consumption
The linux kernel needs to keep track of each process’s complete TLB buffer. Especially when it is unable to fit within the dedicated CPU cache, which often holds only a few thousand addresses. When using the default 4KB pages, we need to store 262144 entries for each 1GB of allocated memory to shared_buffers. At 2MB pages we needed 512 addresses and at 1GiB we just needed 1. The overall amount of memory used for translation grows both with the number of simultaneous connections and the amount of memory allocated to shared_buffers.
For each process, we can look up the amount of memory used to manage its TLB by reviewing that process’s VmPTE value, which is available in /proc/<pid>/status. Every 5 seconds, I added up the VmPTE values reported by each postgresql process and then I selected a 95th percentile of those results to represent each experiment. As shared_buffers grew, so did the memory required by the kernel to manage those addresses.
From these graphs, we can see that up to 20 GB of memory was used by the kernel to keep track of memory addresses. At a maximum of about 100GB of shared_buffers and only 100 clients, this represents up to 20% of total memory usage for 4KB data pages and I expect it to scale both with the size of shared_buffers and the number of simultaneous connections.
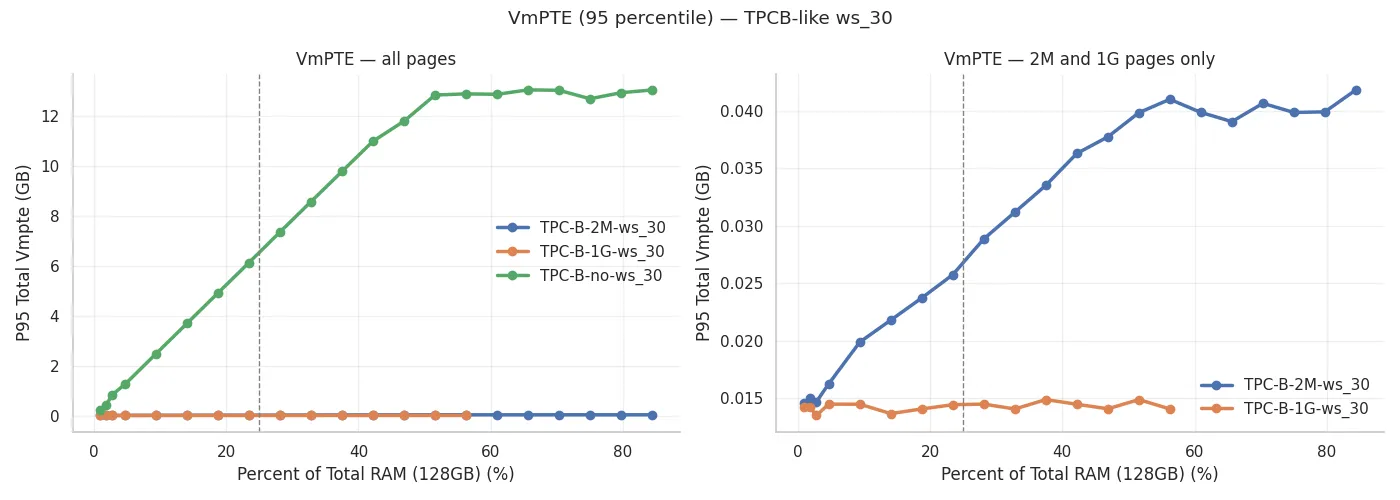
VmPTE 95 Percentile TPBCB-like ws_30
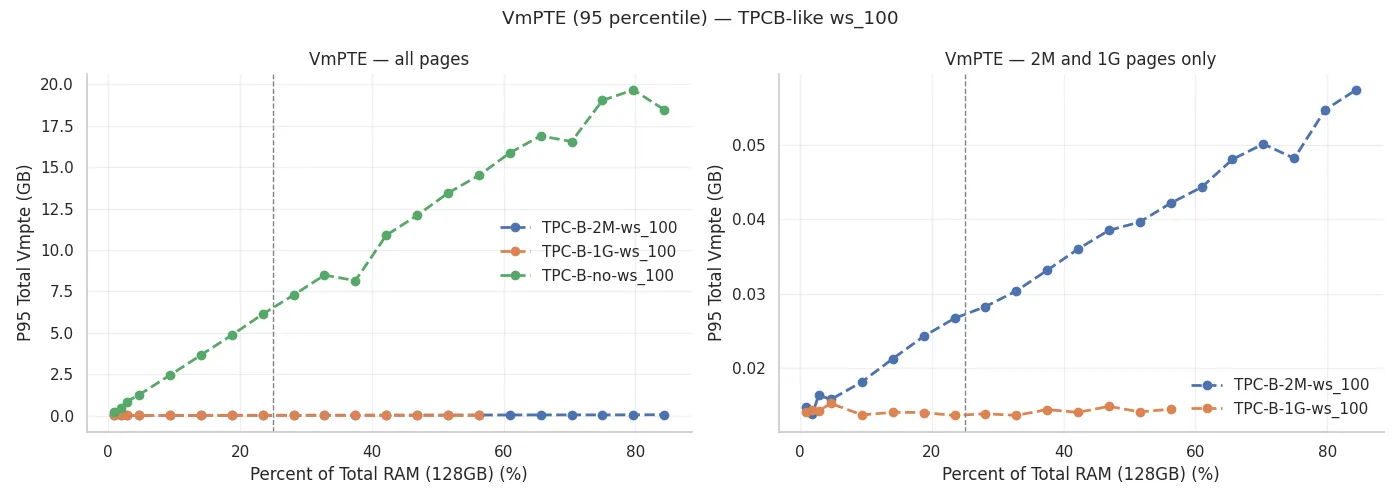
VmPTE (95 percentile) - TPCB-like ws_100
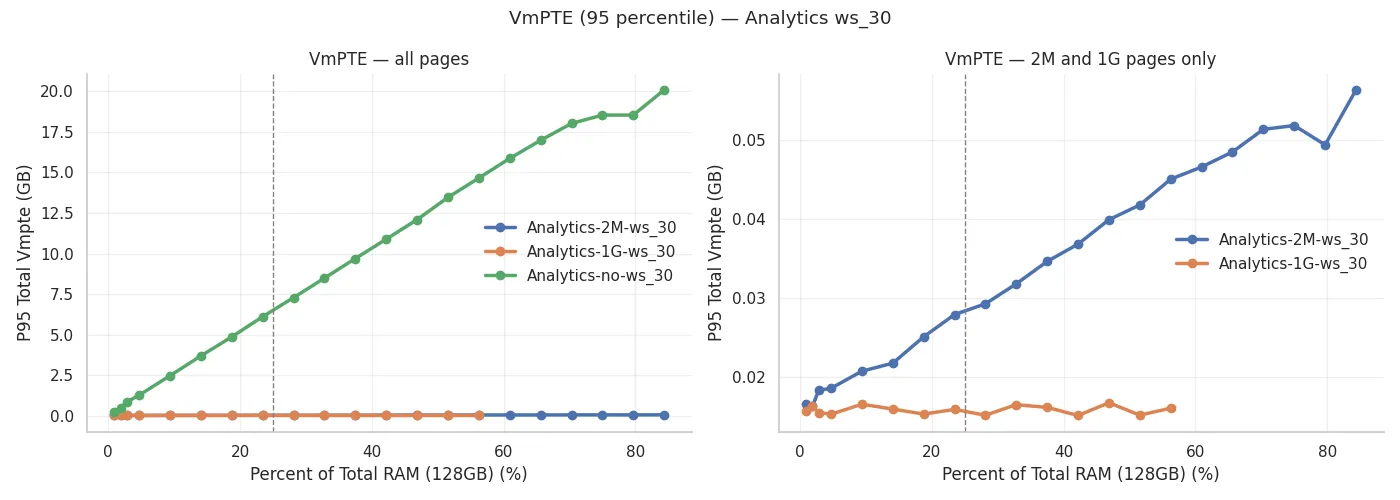
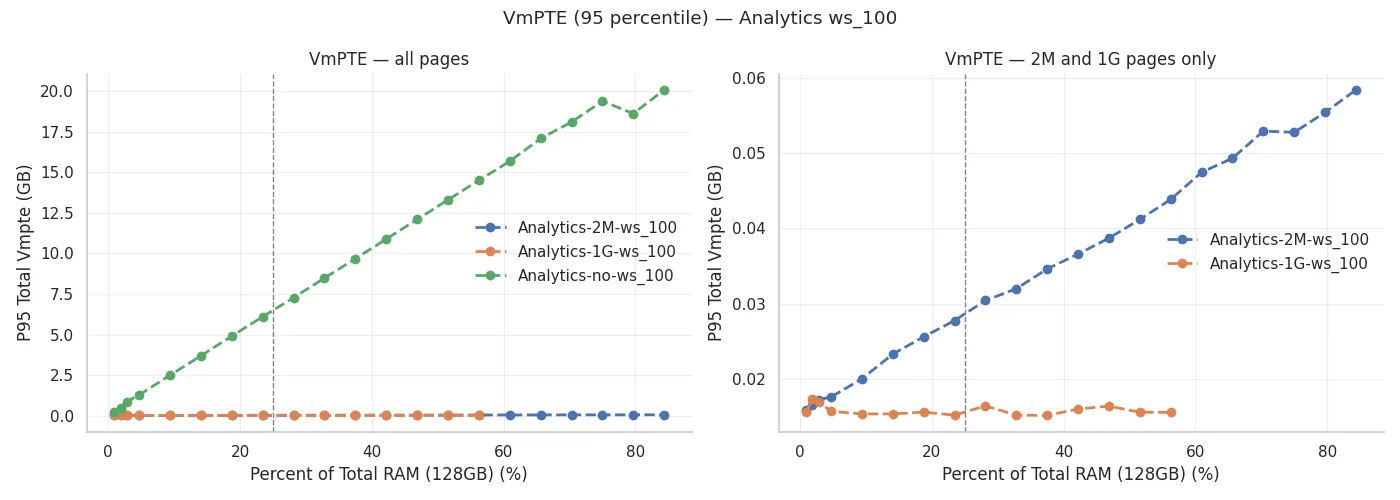
VmPTE (95 percentile) - Analytics ws_100
There is a small anomaly for TPC-B at 30%, which uses a maximum of 12GB of RAM. I believe this is largely because that workload was not able to fully saturate shared_buffers, since most of the lookups were able to utilize dedicated indexes, which were significantly smaller than 30% of the entire database.
Effects of huge_pages on OS File Cache
There is an interesting side effect of allocating a portion of your memory as huge pages. While in all cases, the shared_buffers was set to request a specific amount of memory, when using the default 4kB pages the kernel retains the flexibility of using portions of that memory for file cache.
The “Cached” value of /proc/meminfo does not fall down as quickly as when shared_ buffers are allocated via huge_pages. This could be a factor in why performance remains comparable between these three types of memory allocation, giving the kernel some flexibility in deciding how each page of memory can be used most effectively.
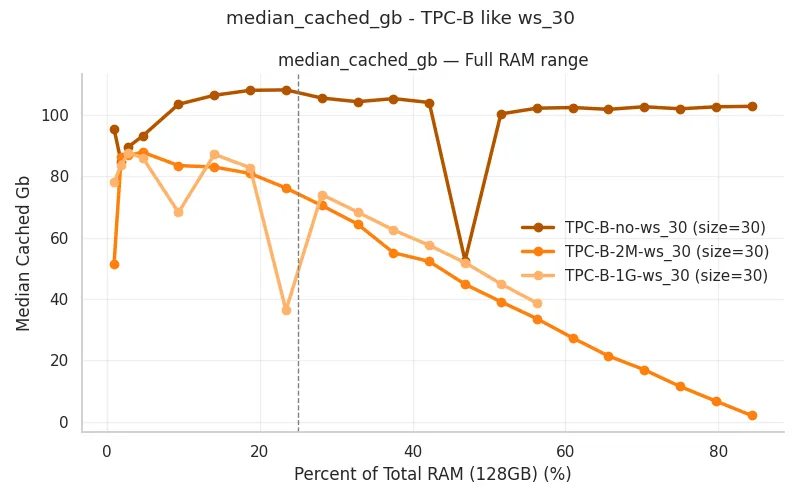
median_cached_gb - TPC-B like ws_30
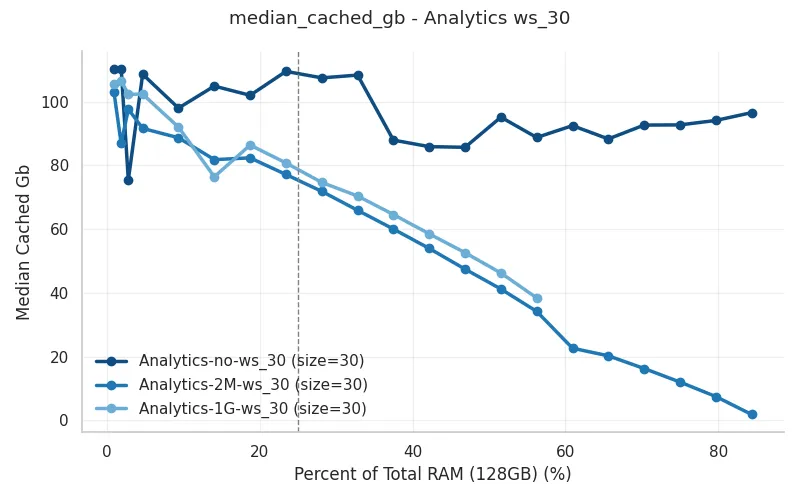
median_cached_gb - Analytics ws_30 Percentage of Total RAM (128GB)
Conclusions
Large memory database servers typically host large databases and often end up being largely IO bound. Allocating shared_buffers via huge_pages is unlikely to result in big performance gains under these conditions as memory translation is unlikely to be a measurable fraction of total execution time as most PostgreSQL bottlenecks live above the memory translation layer,
There are potential gains possible if we are able to reduce the overall memory footprint and use the freed memory more effectively by increasing work_mem for example. This is by no means guaranteed. There is also a possibility that the benefits will increase in a system that is able to execute more simultaneous processes as that would increase memory contention.
One indicator of this is to measure the PSI during busy times (seen in part 1). If the bottleneck is CPU or memory, then there is potential for huge_pages to result in performance improvement. If the bottleneck is disk, then using huge_pages makes sense simply by freeing up a significant amount of memory for other uses, even if it is unlikely to directly result in performance gains under the tested workload.
The indirect effect of this additional memory is highly workload dependent. In these tests I used exactly 100 client connections as this configuration produced the highest throughput for this specific workload. A different workload, higher concurrency or different underlying storage could shift the bottleneck and produce measurable gains. Because there are many possible combinations of concurrency, query shape, memory demand and storage behavior, it is not practical to test every scenario.
Part 3 of this blog series will look more closely at efficiency metrics and break down the workload in terms of impact on CPU, memory and disk individually.
Go deeper with Postgres training and tutorials
Our Performance and Maintenance course covers exactly this territory: shared buffers, the background writer, and provisioning for strict uptime requirements. Every course is tailored to your team.
If you would rather have us find your bottleneck for you, start with a Performance Audit.